
Explore our Services >>>

INSIGHTS & RESOURCES
VIEW ALL INSIGHTS & RESOURCES
May 15, 2023
Beacon Weekly Investment Insights 5.15.23
Chief Investment Officer, John Longo, PhD, CFA, provides insights to guide you through changing market conditions. Please read the full text below or download the PDF version.
The S&P 500 fell 0.3% last week as the first quarter earnings reporting season has slowed to a trickle. Disney set off the wrong kind of fireworks last week, falling 8.5% amid weak earnings in its key streaming business. Volatility continued in the regional banking sector with Pacific West Bancorp plunging another 21% last week, bringing its year-to-date losses to an astonishing 80%. To quote baseball sage, Yogi Berra, when analyzing the regional banking crisis "It ain't over 'til it's over." If you prefer movies to sports, I suggest queuing up the Bill Murray classic, Groundhog Day, for another pop culture analogy apropos to the ongoing banking crisis. Despite these high-profile company specific events, arguably the most important financial news released last week was macro related.
Heightened inflation levels have been in the financial headlines for the last two years, so investors keenly reviewed last week’s report on the Consumer Price Index (CPI). The headline number of 4.9% may be viewed from a glass half full or empty lens, depending on your perspective or predilection. Optimists may view the headline number as the lowest since April 2021. Pessimists may say the number far exceeds the Federal Reserve’s oft cited target of 2%, providing the central bank with some cover to keep raising short-term interest rates. We tend to side with the optimists on this one since futures market are pricing in a low probability of near-term rate hikes. In fact, the market thinks the Fed will cut short-term interest rates at some point in the fourth quarter of this year.
The Producer Price Index (PPI) report, a measure of wholesale inflation, was also released last week. The PPI showed an even smaller increase (+2.3% on a year-over-year basis) than the CPI, due in part to its heavy reliance on commodities. As the pages of the calendar turn, we are inching closer to U.S. Treasury Secretary Janet Yellen’s self-imposed June 1st deadline for Congress to agree on a deal to extend the federal debt ceiling yet again. Although the two primary U.S. political parties are in active discussions, no deal is imminent. Indeed, as we approach June volatility may increase if there is no deal on the horizon. Mark Twain is reported to have said, “History doesn't repeat itself, but it does rhyme.” With this quote in mind, let’s look at S&P 500 performance in 2011, perhaps the last time the debt ceiling fight was this contentious.
As shown in the graph below, the S&P 500 fell sharply (17% from peak to trough) but recovered virtually all of its losses within a few months. We also note that S&P’s widely followed bond rating agency downgraded U.S. government debt from a AAA rating to AA+ during this period. The other main rating agencies, Moody and Fitch, maintained their AAA ratings, or perhaps the damage may have been worse. Our base case is that Congress will once again agree to a debt ceiling increase, but there remains a small probability of default, which may have more severe consequences than the 2011 debt related drama. In any event, the financial media remains fixed on this story and market volatility may follow.
S&P 500 Performance Around 2011 Debt Ceiling Crisis
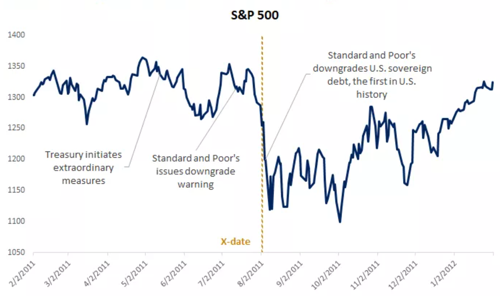
Source: Edward Jones
We mentioned in our introductory paragraph that the 2023Q1 earnings season is largely in the books. However, there is one exception. Retailers tend to report earnings one month later than most other firms since their fiscal years often differ from their calendar years due to the November-January holiday season. Accordingly, retail giants Target and Walmart are expected to report their Q1 earnings this week on Wednesday and Thursday, respectively. Given the size and national footprint of these iconic firms, their earnings reports and outlooks will provide a glimpse of the health of the all-important U.S. consumer. The national Retail Sales report will be released on Tuesday, providing an even broader picture of consumer spending.
Investment managers, such as Warren Buffett of Berkshire Hathaway, will disclose their investment holdings on Monday. These closely watched forms submitted to the SEC, known as 13-F, provide investors with a partial and delayed picture of the hands of successful, and not so successful, fund managers. Fed Governors will be on the road virtually every day this week and their heavily vetted remarks may enable market participants to further calibrate the likelihood of a pause or rate hike in June. The Conference Board’s Leading Economic Index (LEI) will be released on Thursday. LEI has pointed to an economic contraction for the past twelve months and the consensus estimate calls for another drop. As we have stated in our prior writing, an “official” recession is unlikely until the unemployment rate, currently near a 50 year low, increases materially.
|
Market Scorecard: |
5/12/2023 |
YTD Price Change |
|
Dow Jones Industrial Average |
33,300.62 |
0.46% |
|
S&P 500 Index |
4,124.08 |
7.41% |
|
NASDAQ Composite |
12,284.74 |
17.37% |
|
Russell 1000 Growth Index |
2,499.46 |
15.81% |
|
Russell 1000 Value Index |
1,480.88 |
-1.08% |
|
Russell 2000 Small Cap Index |
1,740.85 |
-1.16% |
|
MSCI EAFE Index |
2,126.26 |
11.56% |
|
US 10 Year Treasury Yield |
3.463% |
-43 basis points |
|
WTI Crude Oil |
$70.09 |
-12.94% |
|
Gold $/Oz. |
$2,015.60 |
10.14% |