
Explore our Services >>>

INSIGHTS & RESOURCES
VIEW ALL INSIGHTS & RESOURCES
May 09, 2022
Beacon Weekly Investment Insight 5.9.22
Portfolio Manager, Charles Pawlik, CFA, CFP®, provides insights to guide you through changing market conditions. Please read the full text below or download the PDF version.
After a challenging month for equities in April, the volatility continued through the first week of May. All eyes were on the Fed, and Chair Powell’s remarks relative to the path of monetary policy after the Federal Reserve’s May meeting. As expected, the Fed decided to hike interest rates by 0.50%. Powell noted that additional 0.50% interest rate hikes continue to be on the table for the next couple of meetings, as the Fed moves toward more restrictive monetary policy in an effort to combat inflation. In addition, the Fed will be pursuing quantitative tightening in which they shrink their roughly $9 trillion balance sheet, effectively withdrawing liquidity from the economy. The Fed intends on beginning this process on June 1st, to the tune of $47.5 billion/month, and scaling up to a capped level of $95 billion/month. It is the uncertainty over these policy impacts and the trajectory of inflation, alongside the Russia/Ukraine crisis, lockdowns in China, and concerns over slowing global growth that continue to be the primary culprits driving volatility in markets.
Markets rallied meaningfully after Chair Powell’s remarks on Wednesday, with the S&P 500 closing up roughly 3% and the Nasdaq closing up by roughly 3.2% on the day. Equity markets initially responded positively to Chair Powell’s remark that “a 0.75% hike is not something that the committee is actively considering,” representing somewhat of a less hawkish/restrictive stance than market participants viewed as being a possibility. These strong returns were followed by significant moves down on Thursday, with the S&P 500 down 3.5% and the Nasdaq down 5% on the day. Intraday volatility continued on Friday.
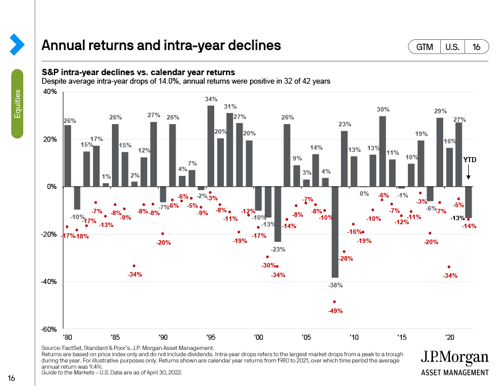
With day-to-day swings in equity markets of the 3%-5% variety, it can be difficult for one to internalize that the S&P 500 ended up closing down just -0.20% for the week. This further underscores the potential hazard in attempting to time markets. A long-term and disciplined approach to investing that contemplates overall goals and objectives, as well as on-going liquidity needs, continues to be our counsel to clients. To that end, and looking at a long-term time-frame for equity markets, the average annual maximum drawdown (the largest sell-off from top to bottom for the year) for the S&P 500 since 1980 has been 14%. As of the close of last week’s trading, the S&P 500 has had a maximum drawdown of almost exactly that 14%. Although it may not feel like it, the volatility we have experienced in equity markets as measured by the maximum drawdown thus far this year, puts us right on par with the long-term average annual maximum drawdown that equity markets have experienced over the last 4 decades. Furthermore, the S&P 500 went on to generate positive returns for the year 76% of the time during this timeframe. The chart produced by J.P. Morgan that we have included below provides the data that underscores this point. Although we do expect continued volatility on a day-to-day basis, it is as important as ever to step back and look at the opportunity that equity markets provide relative to long-term returns.
Another good reminder of remaining long-term oriented and opportunistic was provided by Buffett and company in the latest Berkshire Hathaway annual meeting. The company is deploying capital, adding meaningfully to its stake in Chevron (held in Beacon’s Income and Appreciation Strategy) to the tune of $21 billion, as well as adding to its stake in Apple (held in Beacon’s Core Equity and Income and Appreciation Strategies) by roughly $600 million. In terms of broader corporate earnings, 87% of companies in the S&P 500 have reported results for Q1 2022. Of the companies that have reported, 79% of companies have reported earnings that beat expectations (above historical averages), and 74% of companies have reported revenues that beat expectations. The blended earnings growth rate for the S&P 500 companies that have reported is a healthy 9.1%, albeit representing a lower earnings growth rate than we have seen since Q4 of 2020 if it holds at these levels.
It was also a packed week in terms of economic data releases, with jobs data, as well as ISM Manufacturing and Services PMI figures released. The ISM Manufacturing index came in at a reading of 55.4%, falling for a 2nd straight month, and below expectations of 57.8%. Despite this, with a reading of over 50%, the index continues to signify expansion in the economy. Similarly, although the ISM Services Index did not meet expectations with a reading of 57.1% vs. expectations of 58.3%, the index is still firmly in expansionary territory.
Overall, jobs data continues to underscore a very tight labor market, as well as wage pressures, with roughly 2 open jobs for every available worker. The nonfarm payrolls report released at the end of last week came in with a solid figure of 428,000 jobs added, vs. expectations for 400,000. The unemployment rate was unchanged at 3.6%, coming in slightly above expectations. Average hourly earnings were up 0.3% for the month and 5.5% year-over-year. Notably, the labor force participation rate ticked down to 62.2% from 62.4% and vs. expectations of 62.5%. The recent data continues to support the path that the Fed has laid out in the near-term relative to interest rate hikes. Inflation and consumer sentiment data are on the docket for this week, with CPI (consumer price index) and PPI (producer price index) data due out Wednesday and Thursday, respectively, and the University of Michigan consumer sentiment reading due out on Friday.
|
Market Scorecard: |
5/6/2022 |
YTD Price Change |
|
Dow Jones Industrial Average |
32,899.37 |
(9.46)% |
|
S&P 500 Index |
4,123.34 |
(13.49)% |
|
NASDAQ Composite |
12,144.66 |
(22.37)% |
|
Russell 1000 Growth Index |
2,415.86 |
(21.44)% |
|
Russell 1000 Value Index |
1,551.21 |
(6.31)% |
|
Russell 2000 Small Cap Index |
1,839.04 |
(18.09)% |
|
MSCI EAFE Index |
2,204.09 |
(5.65)% |
|
US 10 Year Treasury Yield |
3.13% |
162 basis points |
|
WTI Crude Oil |
$110.47 |
46.88% |
|
Gold $/Oz. |
1,882.00 |
2.92% |