
Explore our Services >>>

INSIGHTS & RESOURCES
VIEW ALL INSIGHTS & RESOURCES
April 11, 2022
Beacon Weekly Investment Insight 4.11.22
Portfolio Manager, Charles Pawlik, CFA, CFP®, provides insights to guide you through changing market conditions. Please read the full text below or download the PDF version.
The volatility that we are experiencing in equity markets on a daily basis continues to reinforce our belief that an attempt to try and time the markets is not a productive effort for our clients. We remain focused on ensuring that our clients have a well-diversified and appropriate strategic asset allocation in place that contemplates overall goals and objectives over the long-term, and that sufficient liquidity is on hand in portfolios to meet upcoming needs. We continue to assess all of the investments that we recommend with a consistent and disciplined research process, through the lens of a long-term and opportunistic mindset. We believe that this focus continues to best serve our clients in the midst of volatile periods for markets such as this.
After starting off the week in positive territory last Monday, the S&P 500 and the tech-heavy Nasdaq finished the week down -1.2% and -3.8%, respectively. Underneath the hood of the market, more defensive sectors such as Utilities and Consumer Staples showed leadership, as the potential for a recession has continued to grab more headlines. More growth oriented equities such as technology stocks sold off disproportionately during the week, with higher interest rates having the effect of reducing the value of the future cash flows of these companies when discounted back to today at higher rates.
Another round of sanctions were introduced last week by the U.S., the European Union, and the G7 targeting Russia’s largest banks, state-owned entities, families of top Russian officials including Vladimir Putin’s adult children, and any new investment in Russia by U.S. nationals. In addition, a bill that prohibits the importation of oil, gas, coal, and other energy products from Russia was passed, following an executive order signed by President Biden roughly a month ago which mandated the same steps. A bill was also unanimously approved to revoke Russia’s permanent normal trade relations with the United States.
The Fed released the minutes for the March FOMC meeting last Wednesday. The predominant opinion amongst Fed officials is that alongside 0.25% rate hikes, the first of which was enacted in March, one or more rate increases of 0.50% may be necessary as the Fed focuses on tempering higher inflation. To that end, the market is currently pricing in 0.50% rate hikes for the upcoming May and June Fed meetings, with estimated probabilities of 82% and 53%, respectively, as of the time of this writing. The market is also pricing in an additional 0.50% rate increase for the July meeting, followed by 0.25% rate increases for the September, November, and December meetings. The present path for rate hikes being priced in by the market would have the Fed Funds rate end the year at 2.50%.
A higher degree of uncertainty and thus a greater source of volatility for the markets was centered around questions as to the magnitude and timing by which the Fed will embark on quantitative tightening. This is the process in which the Fed shrinks its balance sheet (currently roughly $9 trillion) as a means of decreasing liquidity in the economy and as an additional tool to combat inflation, alongside rate hikes. The minutes showed that the Fed expects to start this process after the May FOMC meeting with a 3-month phase-in period, and sees the balance sheet shrinking at a capped level of $95 billon/month, consisting of $60 billion/month of US Treasuries and $35 billion/month of mortgage-backed securities. Equity and fixed income markets turned down subsequent to the release of the minutes.
The yield curve, as measured by the difference/spread between the 2-year and 10-year treasury yields, again inverted last week with the 2-year treasury yield briefly moving above the 10-year yield by a small amount, before reverting back meaningfully below the 10-year yield by the end of the week. The brief inversion of the 2-year and 10-year treasury yield curve continues to prompt discussion about a potential recession on the horizon. The inversion has historically been a potential indicator of an upcoming recession, albeit typically at a significant lag. Many different combinations of treasury maturities in addition to the spread between yields on 2-year and 10-year treasury yields, such as the difference between the yield on 3-month treasury bills and the 10-year treasury yield, can be looked at as potential indicators of a recession. It is important to note that although every recession since 1955 has been preceded by an inverted yield curve (providing just one false signal since that time), not every instance of an inverted yield curve has in fact led to a recession. It is also important to note that the reliability of a yield curve inversion as an accurate predictor of a recession also depends on the magnitude and the duration of the yield curve inversion, as well as on having confirming signals from yield spreads across other treasury maturities. As the chart below shows, the percent of US Treasury yield curves that are inverted across varying maturities is roughly 20% (closer to 25% as of the time of this writing). With the exception of the pandemic induced recession (recessions are detailed by the gray bars), in excess of 70% of the yield curve has inverted prior to past recessions. This would indicate that we do not yet have enough of a confirming signal from the yield curve to reliably suggest that a recession may forthcoming.
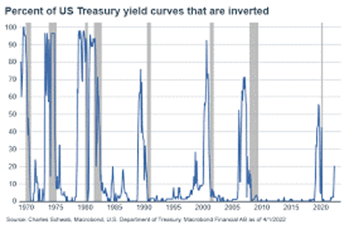
Under the presumption that a yield curve inversion does end up being a reliable indicator of an impending recession, there is typically a substantial lag from the time the yield curve inverts, to the onset of the recession. That lag time has averaged about 22 months, and has ranged from 6 months to up to 3 years. In addition, as we shared in our last weekly insights piece, forward 12-month returns for the S&P 500 tend to be quite good subsequent to a yield curve inversion.
Recent economic data such as the ISM Services report continue to point to a healthy economy, with the composite reading coming in at 58.3 for March, up 1.8% from last month (a reading above 50 signifies expansion). Earnings season is set to kick off this week, with big banks such as J.P. Morgan, Goldman Sachs, Citigroup, and Wells Fargo all set to report. Corporate earnings for the S&P 500 are expected to grow by a healthy 9% for 2022. Economic data on tap for this week includes inflation data with the CPI (consumer price index) and PPI (producer price index) reports set to be released on Tuesday and Wednesday, respectively. In addition, retail sales, consumer sentiment, and additional manufacturing data are all set to be released.
|
Market Scorecard: |
4/8/2022 |
YTD Price Change |
|
Dow Jones Industrial Average |
34,721.12 |
(4.45)% |
|
S&P 500 Index |
4,488.28 |
(5.83)% |
|
NASDAQ Composite |
13,711.00 |
(12.36)% |
|
Russell 1000 Growth Index |
2,712.16 |
(11.80)% |
|
Russell 1000 Value Index |
1,644.46 |
(0.68)% |
|
Russell 2000 Small Cap Index |
1,994.56 |
(11.17)% |
|
MSCI EAFE Index |
2,204.09 |
(5.65)% |
|
US 10 Year Treasury Yield |
2.71% |
120 basis points |
|
WTI Crude Oil |
$97.88 |
30.14% |
|
Gold $/Oz. |
1,950.10 |
6.64% |