
Explore our Services >>>

INSIGHTS & RESOURCES
VIEW ALL INSIGHTS & RESOURCES
August 01, 2022
Beacon Weekly Investment Insight 8.1.22
Head of Investment Strategy, Brian McGann, CFA, provides insights to guide you through changing market conditions. Please read the full text below or download the PDF version.
Quite a busy week to end the trading month of July with corporate earnings, a Federal Reserve interest rate hike, GDP data that pointed negative for the second consecutive quarter, and some movement on the political front with the passing of legislation for the semiconductor industry and movement on a slimmed down spending and tax bill. Before we address each of these topics, here are the market statistics. For the week, the Dow Jones Industrial Average rose 2.97%, the S&P 500 index rose 4.26% and the NASDAQ Composite rose 4.72%. More eye in opening, for the month of July the Dow rose 9.7%, the S&P rose 9.1% and the NASDAQ Composite rose 12.3%. On the fixed income side, yields on the benchmark 10-year US Treasury declined by 12 basis points on the week and 24 basis points for the month to close July yielding 2.64%.
On Wednesday, the Open Market Committee of the Federal Reserve raised the Fed Funds rate by 0.75% to a target range of 2.25% -2.50%, continuing their efforts to cool persistently high inflation. In the press conference following the announced rate hike, Chairman Jerome Powell alluded to future rate hikes being data dependent and possibly smaller than the past two 75 basis point increases. His view is based on inflationary pressures cooling in the months to come as demand throughout the economy begins to slow. There is no Fed meeting in the month of August, so September will be the next scheduled time for any rate decision. Between now and then, the Fed’s Board of Governors will have plenty of economic data to interpret on growth, inflation, employment, and sentiment expectations as they formulate their policy decisions. Chairman Powell will give a closely watched speech at the annual Jackson Hole Economic Symposium in late August.
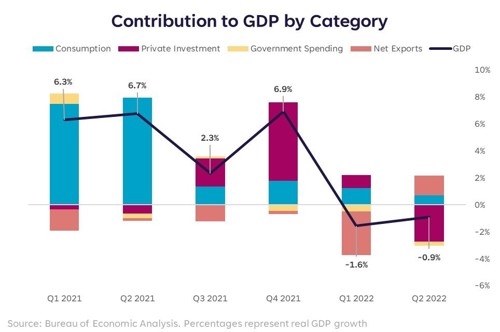
The first release of US second quarter GDP was released on Thursday and it indicated that the economy contracted by 0.9%, following the first quarter contraction of 1.6%. The below chart sourced from the Bureau of Economic Analysis illustrates 5 components that contribute to the GDP calculation. As you can see, the largest detractor in the second quarter was private investment which is a measure of corporate spending on inventories. You will note the massive contribution in the fourth quarter of 2021, which has been referenced by many big-box retailers like Target and Walmart who are in the process of “working down” excess inventory that did not sell earlier in the year. On a positive note, consumption and net exports were positive influences.
The debate will continue over the coming months about the definition of recession. Traditionally, recessionary periods are signaled with slowing growth along with a weaker labor market. While we have seen companies announcing a pause in hiring plans or a reduction in workforce, the labor market has yet to show broad weakness. This Friday, August 5th we will have July’s unemployment report to analyze.
Last week’s corporate earnings calendar was dominated by many of the largest technology companies by market capitalization. Apple, Microsoft, Alphabet (parent of Google), Amazon, Meta (formerly known as Facebook) all reported quarterly results that in general were slightly weaker than expected, but not weak enough to create any negative sentiment. Within Apple, Microsoft, and Amazon for example, were positive data points. The US Dollar’s strength effected each when they translate foreign revenue and earnings back into US Dollars. Outside of technology, companies such as Procter and Gamble, McDonalds, 3M, Coca Cola, General Motors, and Ford also reported earnings with similar mixed results. Overall, earnings season for second quarter reports has not been as weak as expected. We will have more statistics on the overall quarter in the coming weeks.
In Washington DC, we had some movement on a bill called the Chips and Science Act which will provide subsidies and tax support for the semiconductor industry to increase capacity here in the US over the next five years. The bill was approved by both houses of Congress, and is meant to address part of the reason we have ongoing supply chain issues throughout the economy from auto manufacturing to household appliances. Additionally near the end of the week, news broke of an agreement between Senate Majority Leader Schumer and Senator Joe Manchin from West Virginia to move forward with a spending bill on climate and energy programs along with provisions addressing pharmaceutical pricing and extending subsidies for the Affordable Care Act. Funding is coming primarily from tax increases such as a 15% corporate minimum tax. More details to follow on this as negotiations continue.
As we look to data this week, we will have another busy earnings release week across a wide variety of economic sectors. ISM will release their monthly survey of activity for the manufacturing sector on Monday and the services sector on Wednesday. Pricing data within both of these surveys will be widely watched for evidence of cooling prices. Thursday, we will have weekly jobless claims, which in recent weeks have crept up into the 250,000 range. Friday, the Bureau of Labor Statistics will release July’s unemployment report with expectations for 250,000 jobs added and an unemployment rate of 3.6%, unchanged from the prior month.
|
Market Scorecard: |
7/29/2022 |
YTD Price Change |
|
Dow Jones Industrial Average |
32,845.13 |
(9.61)% |
|
S&P 500 Index |
4,130.29 |
(13.34)% |
|
NASDAQ Composite |
12,390.69 |
(20.80)% |
|
Russell 1000 Growth Index |
2,464.96 |
(19.84)% |
|
Russell 1000 Value Index |
1,519.99 |
(8.20)% |
|
Russell 2000 Small Cap Index |
1,727.76 |
(16.04)% |
|
MSCI EAFE Index |
1,937.26 |
(17.07)% |
|
US 10 Year Treasury Yield |
2.64% |
113 basis points |
|
WTI Crude Oil |
$98.62 |
31.13% |
|
Gold $/Oz. |
1,765.94 |
(3.43)% |